Tree canopy mapping is becoming more useful in early-stage site analysis.
For architects, surveyors, planners and land professionals, the challenge is not just seeing that trees exist. It is understanding how tree cover relates to the site, the building line, neighbouring properties, access routes, boundaries and levels.
That is where CAD-ready tree canopy mapping can save time.
Instead of tracing trees manually from aerial imagery or waiting for later survey inputs, professional teams can start with structured tree canopy data inside their CAD environment.
MapServe supplies the National Tree Map™ in DWG and DXF as an add-on to OS MasterMap®. It provides tree location, height and canopy data for individual trees and closely grouped crowns over 3m in height.
Why CAD-ready tree canopy data matters
Many project teams still begin with a base map and then manually interpret tree cover from photographs, satellite imagery or site notes.
That can work for rough context, but it creates problems when the information needs to be drawn, measured, layered or shared.
CAD-ready tree canopy data is more useful because it can be:
- switched on and off as a layer
- measured against buildings and boundaries
- combined with OS MasterMap®
- checked against access and layout proposals
- exported into working drawings
- shared with consultants
- used to brief arboriculturists and planners
This makes tree canopy data especially useful for professionals already working with CAD plans during feasibility or planning preparation.
For architects and surveyors, the biggest advantage is workflow efficiency. Tree context becomes part of the drawing environment rather than a separate visual reference.
What tree canopy mapping shows
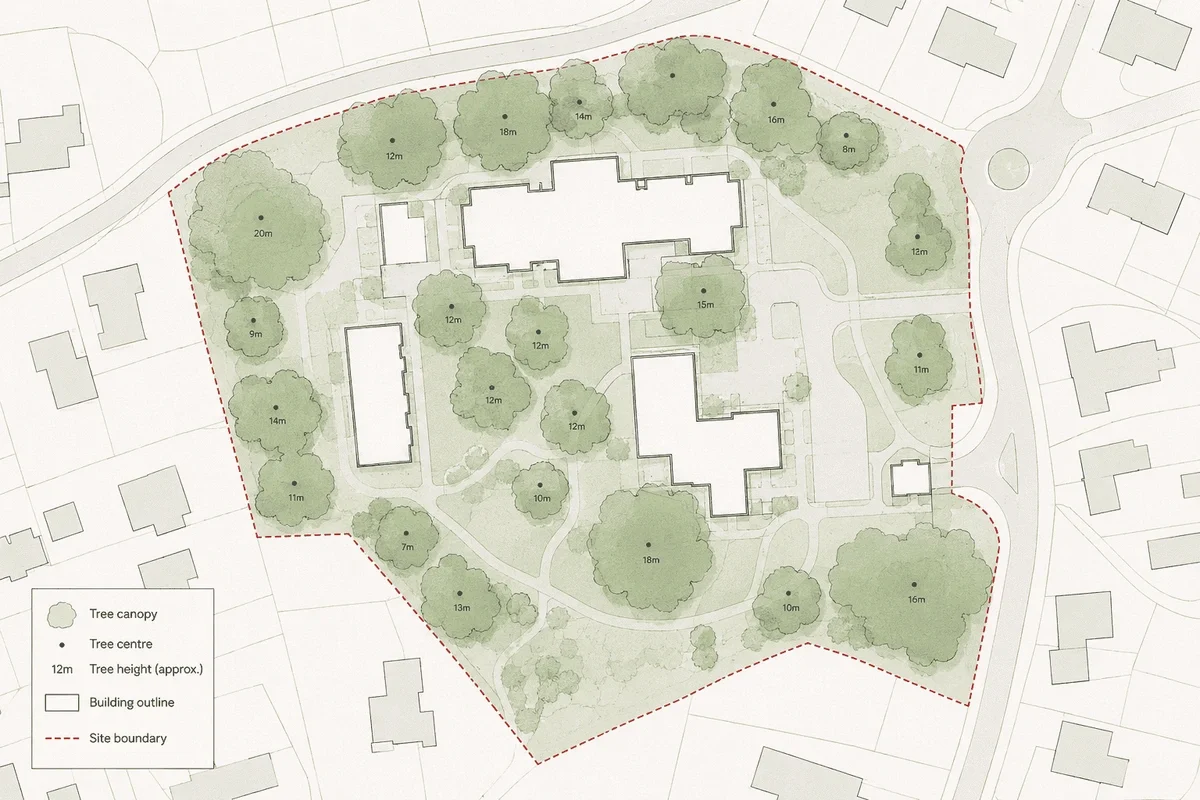
Tree canopy mapping shows the extent of tree crowns or canopy areas. Depending on the dataset, it may also include tree points, height values and other attributes.
MapServe’s National Tree Map™ layer includes:
- tree canopy area polygons
- centre point locations
- simplified circular canopy polygons
- maximum height values
- average canopy height values
- height variation values
- survey date information
- canopy perimeter length
- detailed irregular canopy polygons
These layers help professionals understand not just where trees are, but how much space they occupy in relation to the surrounding site.
Why architects use tree canopy mapping
Architects often need to make early design decisions before every technical survey is complete.
Tree canopy mapping can help answer practical design questions:
- Where are the most significant existing trees?
- Are canopies close to the proposed building footprint?
- Could an access route conflict with existing tree cover?
- Are trees likely to influence outlook or daylight?
- Does the layout need to allow more space around boundaries?
- Should the project team request arboricultural input earlier?
This can be especially useful on infill sites, backland plots, garden development sites and edge-of-settlement schemes, where tree cover can strongly influence the design response.
Why surveyors use tree canopy mapping
Surveyors can use tree canopy mapping to provide useful context before or alongside measured survey work.
It can support:
- desktop site review
- survey scoping
- base plan preparation
- preliminary constraints drawings
- client discussions
- comparison with topographic survey information
- highlighting where additional tree survey work may be needed
Tree canopy mapping is not a replacement for a measured topographic survey or arboricultural survey. But it can provide a strong reference layer where early context matters.
For example, if a topographic survey captures trunks and key visible site features, tree canopy mapping can add wider canopy context that may not always be fully represented in a standard measured survey deliverable.
Tree canopy mapping vs tracing from aerial imagery
Tracing tree canopies manually from imagery can seem quick, but it often creates hidden inefficiency.
Manual tracing can be:
- inconsistent
- time-consuming
- difficult to verify
- hard to attribute
- unsuitable for repeatable workflows
- dependent on image quality
- detached from structured height information
A CAD-ready tree canopy layer gives the user structured geometry and attributes from the outset.
This is particularly useful when drawings need to be revised, reused or shared between consultants.
How to combine tree canopy data with other map layers
Tree canopy data becomes more useful when combined with the right base and context layers.
For most professional workflows, the strongest setup is:
OS MasterMap®
Use OS MasterMap® as the accurate base map for buildings, roads, paths, walls and other site features.
National Tree Map™
Add canopy, crown and height data to understand existing tree cover.
Freehold boundaries
Useful where ownership, title extent or neighbouring land relationships matter.
1m contours
Useful where levels, drainage, access gradients or cut-and-fill risk need early review.
Building heights
Useful in urban settings where tree height, massing and surrounding built form need to be understood together.
MapServe’s National Tree Map™ page specifically positions the dataset as useful alongside OS MasterMap®, contours, boundaries and building heights for environmental context, site analysis and planning work.
CAD formats: DWG vs DXF for tree canopy mapping
MapServe supplies the National Tree Map™ in both DWG and DXF formats.
The right choice depends on the user’s software and workflow.
DWG
DWG plans are commonly used in AutoCAD-based workflows and are often preferred by architects, CAD technicians and design teams who want a native drawing file.
DXF
DXF is useful when exchanging data between different CAD, GIS or design platforms. It can be a safer option where compatibility matters.
For many professional users, the key point is not simply the file type. It is whether the tree data arrives in a usable, layered, CAD-ready structure.
How tree canopy mapping supports planning work
Planning risk often emerges when site constraints are discovered too late.
For a broader look at how tree data supports development, environmental planning and site appraisal, see our guide to using National Tree Map™ data for sustainable development.
Tree canopy mapping can help planning teams:
- identify tree cover before submission
- decide whether a tree survey is needed
- consider design impact earlier
- understand neighbouring tree context
- spot potential conflicts around access
- support pre-application discussions
- brief consultants more clearly
However, there are limits.
MapServe notes that the National Tree Map™ should not be treated as a replacement for an on-site arboricultural survey where tree condition, species, root protection areas or BS5837 information is required.
That makes it best suited to early-stage screening, feasibility and CAD context.
Common mistakes to avoid
Mistake 1: Treating canopy data as legal protection data
Tree canopy data does not confirm whether a tree has a Tree Preservation Order or whether it sits within a conservation area. Those checks should be carried out separately.
Mistake 2: Assuming every tree is included
The National Tree Map™ focuses on trees and bushes over 3m in height. Lower vegetation may not be included.
Mistake 3: Replacing a site survey with desktop data
Desktop tree data is useful, but it cannot confirm condition, defects, species or current site changes.
Mistake 4: Using the wrong base map
Tree canopy mapping is much more useful when placed over an accurate professional base map such as OS MasterMap®.
Mistake 5: Checking trees too late
The earlier tree context is reviewed, the more useful it is. Late discovery often means redesign rather than design guidance.
Practical workflow for architects and surveyors
A good CAD workflow could look like this:
- Order OS MasterMap® for the project site.
- Add National Tree Map™ as a CAD layer.
- Open the DWG or DXF in your preferred CAD software.
- Review canopy spread, height and tree positions.
- Compare tree data with boundaries, access and proposed layouts.
- Flag areas where arboricultural input may be needed.
- Share the drawing with the project team before detailed design progresses.
This helps turn tree data into a practical design and planning tool.
Conclusion
Tree canopy mapping is most valuable when it is available early, accurate enough for professional context and easy to use in CAD.
For architects, planners, surveyors and developers, CAD-ready tree canopy data can reduce manual tracing, improve early site understanding and help identify tree-related design or planning risks before they become expensive.
MapServe’s National Tree Map™ in DWG and DXF gives project teams tree location, height and canopy context alongside OS MasterMap®, making it a practical addition to site analysis and planning workflows.
Add tree canopy, height and location data to your CAD mapping with MapServe’s National Tree Map™:
FAQs
What is tree canopy mapping?
Tree canopy mapping shows the spread or crown extent of trees, usually as mapped polygons or features.
Can I get tree canopy data in DWG?
Yes. MapServe supplies National Tree Map™ data in DWG format alongside OS MasterMap®.
Is DXF available for tree canopy mapping?
Yes. MapServe also supplies the National Tree Map™ in DXF format.
Does tree canopy mapping include tree height?
MapServe’s National Tree Map™ layer includes maximum height and average canopy height values.
Is tree canopy mapping suitable for planning?
It is useful for early planning context and constraints screening, but it does not replace a BS5837 arboricultural survey where one is required.