Instant Download
Colour And Black & White Options
Save up to 40% vs. Other Suppliers
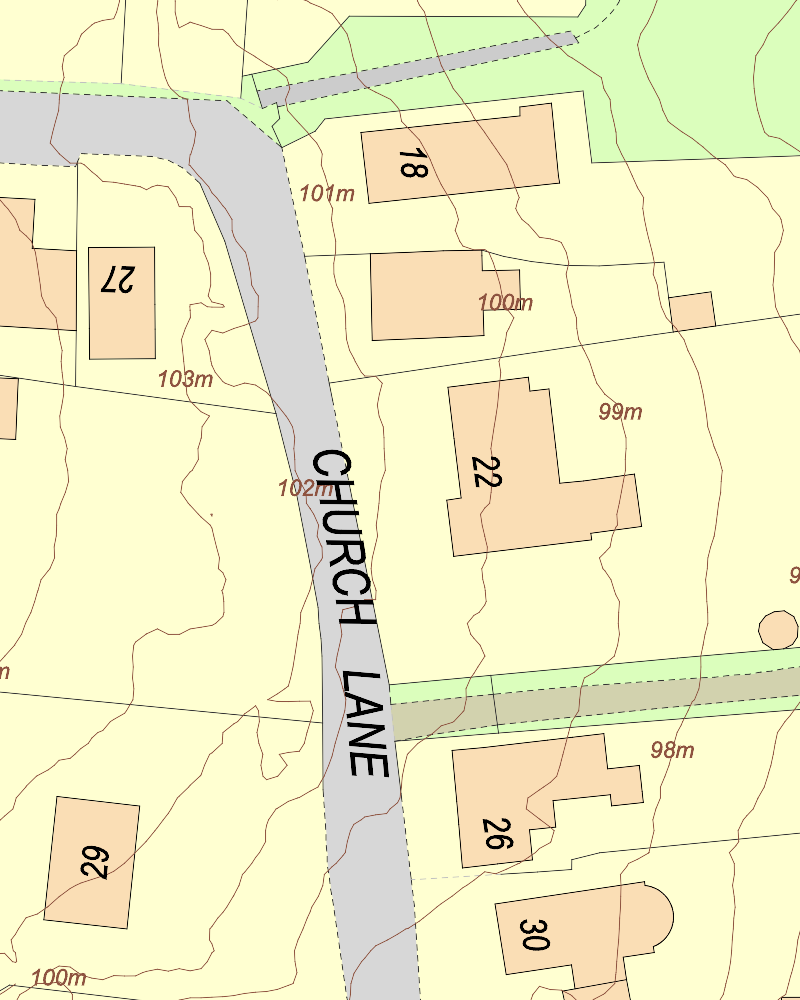
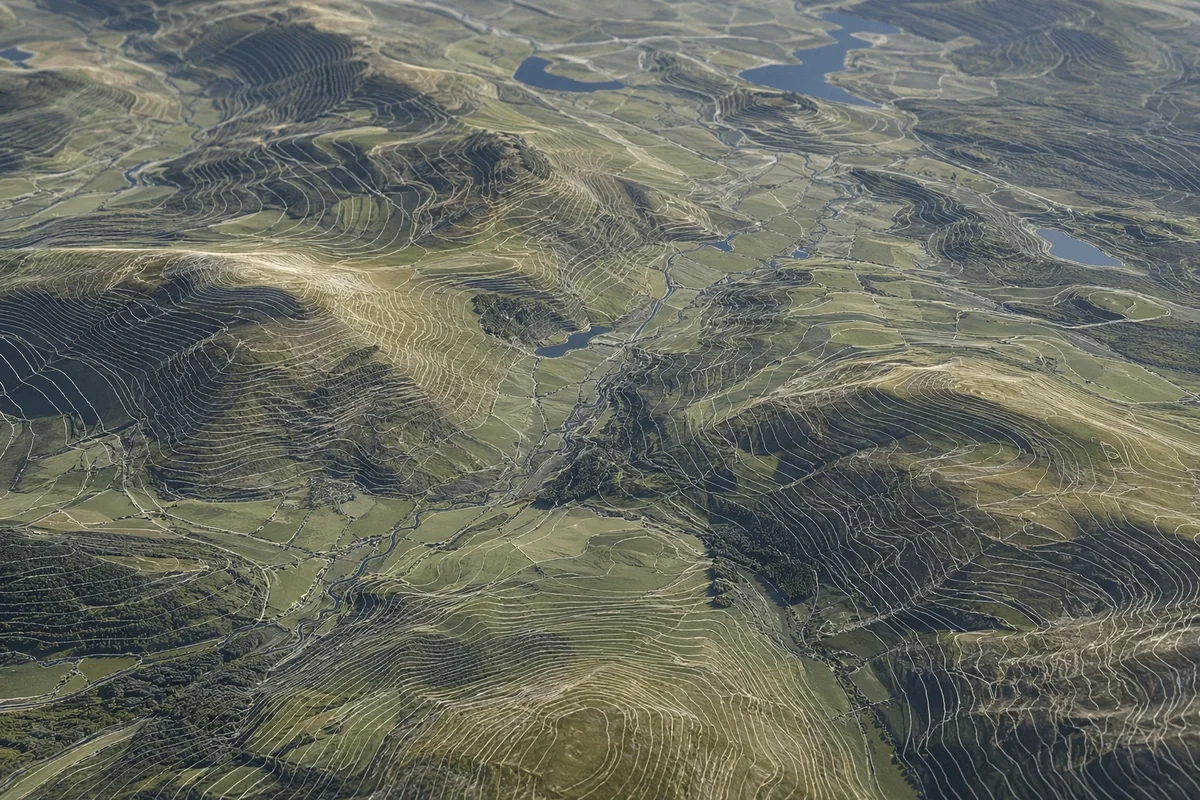
A topographical map provides a detailed representation of the land’s shape, showing how elevation changes across a site. It allows architects, planners and engineers to quickly understand levels, slopes, drainage patterns and physical constraints before design work begins.
Topographical maps use contour lines to represent changes in height, with closer lines indicating steeper gradients and wider spacing showing flatter ground. This makes them essential for assessing site conditions and informing early-stage design decisions.
MapServe’s topographical mapping is supplied as a CAD-ready layer alongside OS MasterMap®, using accurate 1m contour lines to clearly show elevation changes in DWG and DXF formats for seamless integration into professional workflows.

| Sector | Need | Why it's used | Typical format |
|---|---|---|---|
| Architecture | Site levels context | Understand slope before design | DWG, DXF |
| Planning | Constraints review | Assess landform, access and development impact | DWG, DXF |
| Engineering | Drainage and gradients | Review fall, low points and earthworks risk | DWG, DXF |
| Surveying | Terrain reference | Add contour context to CAD mapping | DWG, DXF |
| Development | Feasibility | Identify sloping sites and abnormal costs earlier | DWG, DXF |
| Map product | Best used for | Key limitations |
|---|---|---|
| Topographical map (1m contours) | Understanding landform, slope and elevation changes for planning and early design | Does not provide verified site-specific detail or feature accuracy |
| Measured topographic survey | Accurate site levels and physical features for construction and detailed design | Requires on-site survey work and is typically more expensive |
| OS Terrain 5 | Broad terrain modelling and regional elevation context | Less detailed than 1m contours for site-level analysis |
| LiDAR data | High-resolution surface modelling across larger areas | Requires processing and interpretation; not CAD-ready for most users |
| Aerial photography | Visual site context and surrounding features | Does not provide structured elevation or contour data |
Topographical maps should not be used as a substitute for a measured topographic survey where precise, site-specific detail is required. While contour data provides a reliable overview of landform and elevation, it does not capture exact levels or the position of physical features on the ground.
For projects that require verified accuracy — such as construction, detailed design or setting out — a measured survey is needed to confirm elements such as kerb lines, drainage features, thresholds, walls, trees and other site constraints.
| Attribute | Description |
|---|---|
| Coverage | Great Britain |
| Formats | CAD (DWG & DXF) |
| Options | Colour, black & white |
| Printable scales | 1:100 – 1:10,000 |
| Stated accuracy | Urban +/- 1m, rural +/- 2.5m, moorland / mountain +/- 8m |
| Updates | Yearly |
| Delivery | Within seconds of ordering |
| Licence options | 12 months (other options available on request) |
| Projection | OSGB36 geodetic datum using Transverse Mercator projection |
| Grid | British National Grid |
| Best used for | Slope, drainage, feasibility and site analysis |
| Price | From £13.72 |
| Contour interval | 1 metre |
| Base mapping | OS MasterMap® |
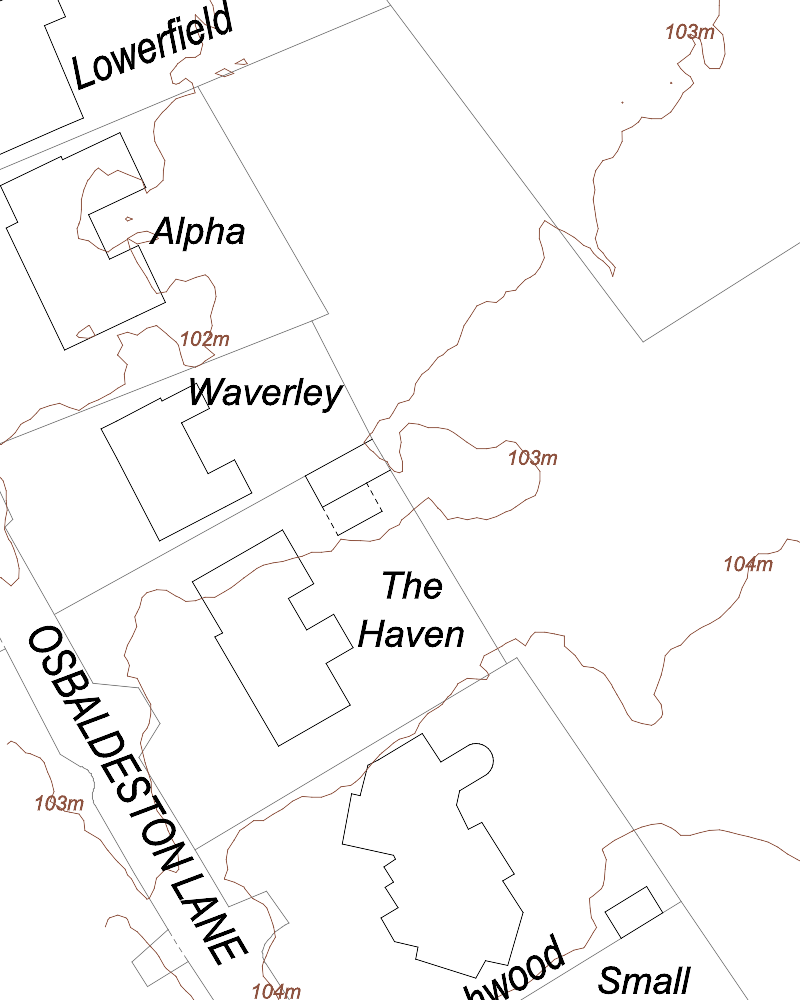
A topographical map shows landform and elevation, usually using contour lines.
A topographic map contains detailed information about an area's elevation, geography, and natural features, as well as contour lines that depict height changes. In contrast, a regular map emphasises boundaries, cities, roads, and political divisions rather than elevation or distinctive geographical features.
Topography refers to the physical characteristics of a specific place or region, particularly the land's surface. It is the organisation of natural and man-made physical features such as mountains, valleys, rivers, forests, highways, and structures. To effectively depict the spatial relationships between these features, topography frequently includes measuring and mapping them. Topographic maps, for example, show precise depictions of terrain elevation, contours, and other features to help with navigation, urban planning, resource management, and other tasks.
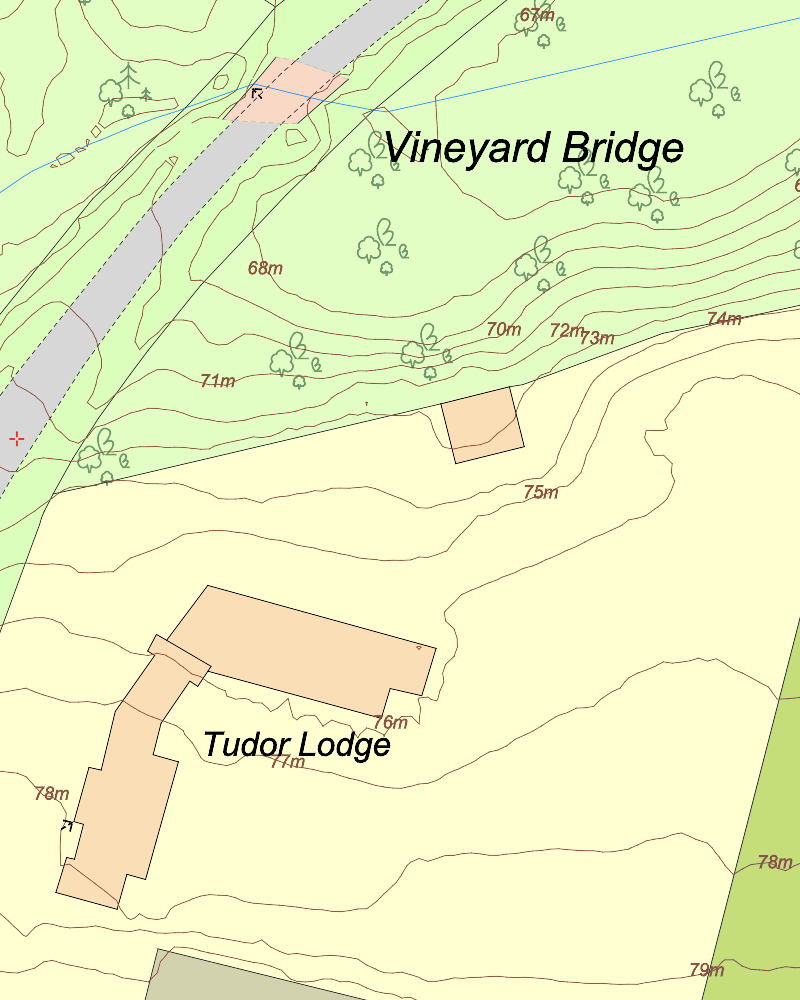
A topographic map depicts an area's height, geography, and natural features in great detail. It incorporates contour lines to indicate height changes, as well as information like drainage, forest cover, highways, and population density. (link to: https://www.mapserve.co.uk/blog/contour-maps-a-guide)
MapServe supplies topographical mapping in DWG and DXF formats.
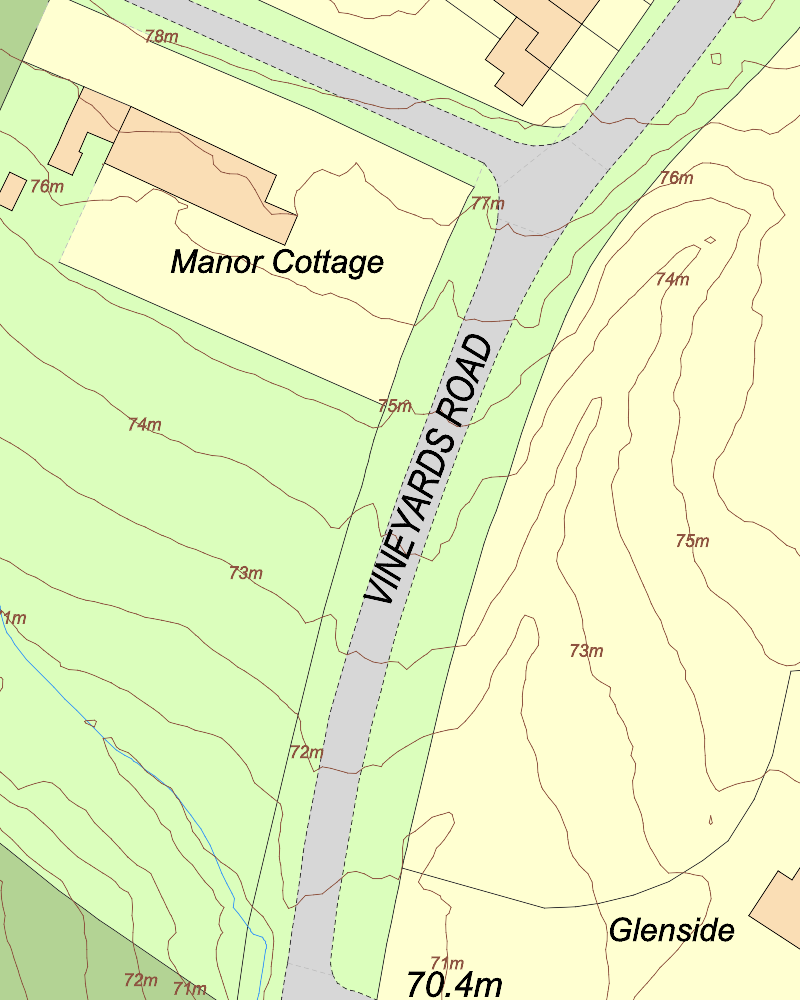
Topography refers to the surface features of a particular area, including its elevation, terrain, and landmarks, as depicted on a topographical map.
You can make your own topographical map using our 1m contours layer.
Contour lines are typically shown on a topography map as curved lines that connect points of equal elevation above or below a reference point, such as sea level. These lines illustrate the shape and steepness of the terrain, with closely spaced lines indicating steep slopes and more gradual changes in elevation represented by widely spaced lines.
No. It is useful for desktop assessment, but a measured survey should be used where exact site levels are required.
Topographical Maps are available from MapServe from £13.72.
No, Google Maps is not primarily a topographic map. While it does provide some terrain features and elevation data through its "Terrain" view option, it primarily focuses on road networks, points of interest, and satellite imagery for navigation and location services. You can get accurate topographical mapping through our website.


