Instant Download
Colour And Black & White Options
Save up to 40% vs. Other Suppliers


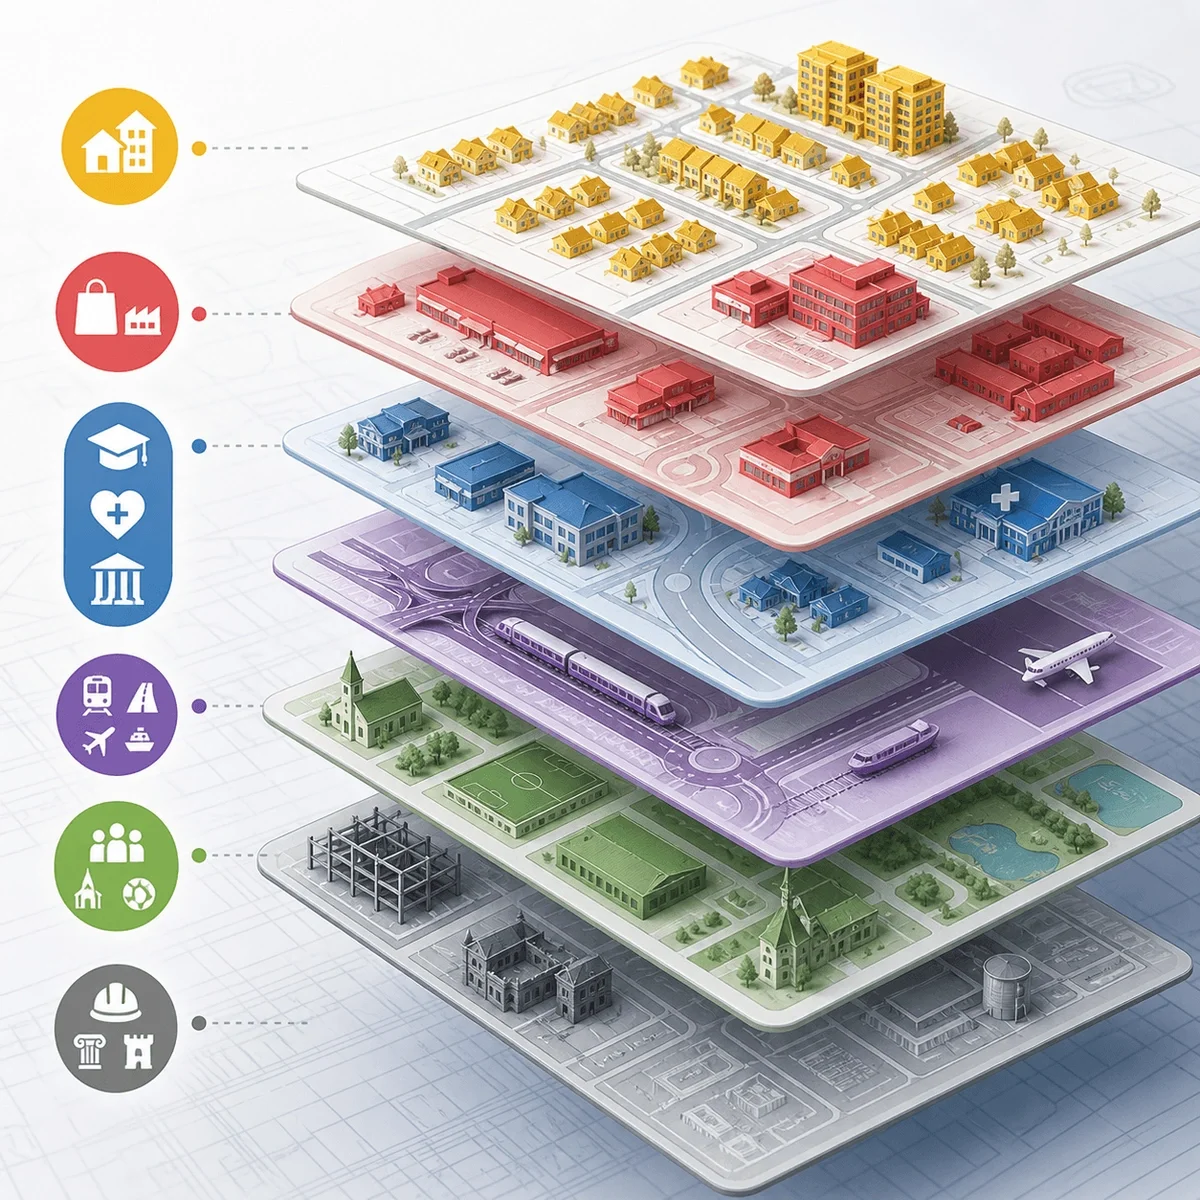
Building Use Data provides classification information for buildings, helping professionals understand how surrounding properties are likely to be used.
This additional context goes beyond standard mapping, identifying uses such as residential, commercial, industrial or mixed-use to give a clearer picture of how a site fits within its wider environment.
It is particularly useful during early-stage site appraisal, planning research and land-use analysis, where understanding neighbouring development patterns, density and function can inform design decisions and project feasibility.
MapServe supplies Building Use Data as a structured CAD layer alongside OS MasterMap®, allowing building classifications to be clearly visualised and analysed directly within DWG and DXF workflows without additional processing.

| Sector | Need | Why it's used | Typical format |
|---|---|---|---|
| Planning | Local context review | Understand surrounding land-use patterns | DWG, DXF |
| Architecture | Site appraisal | Assess neighbouring building types and context | DWG, DXF |
| Development | Feasibility | Review nearby residential, commercial and public uses | DWG, DXF |
| Surveying | Property analysis | Add building classification context to mapping | DWG, DXF |
| Environmental | Receptor screening | Identify nearby sensitive uses for early assessment | DWG, DXF |
| Map product | Best used for | Key limitations |
|---|---|---|
| Building Use Data (OS-based) | Understanding surrounding land use, development patterns and site context at scale | May not reflect recent changes or site-specific conditions |
| Local authority planning records | Verified planning use, permissions and official land use designations | Can be fragmented, time-consuming to access and not CAD-ready |
| Site surveys / site visits | Confirming actual building use and on-the-ground conditions | Time-intensive and limited to specific locations |
| Commercial property databases | Market-level insights, occupancy and property listings | May require subscriptions and not spatially aligned for CAD use |
| Aerial photography | Visual context and surrounding development patterns | Does not provide structured or classified building use data |
Building Use Data should not be relied upon where confirmed or up-to-date building use is required.
The classifications are derived from national datasets and may not reflect recent changes, temporary uses or site-specific conditions.
For planning decisions, legal matters or due diligence, building use should be verified through local authority records, site inspection or official documentation rather than mapping data alone.
Building Use Data also does not provide detail on internal layouts, occupancy, ownership or operational status, and should not be used as a substitute for detailed surveys or property records.
| Attribute | Description |
|---|---|
| Coverage | Great Britain |
| Formats | CAD (DWG & DXF) |
| Options | Colour, black & white |
| Printable scales | 1:200 – 1:10,000 |
| Stated accuracy | Urban +/- 1m, rural +/- 2.5m, moorland / mountain +/- 8m |
| Updates | Up to daily updates to data |
| Delivery | Within seconds of ordering |
| Licence options | 12 months (other options available on request) |
| Projection | OSGB36 geodetic datum using Transverse Mercator projection |
| Grid | British National Grid |
| No. of Layers | 28 (Commercial, industrial, medical, retail, construction, education and much more) |
| Base mapping | OS MasterMap® |
| Price | From £13.72 |
| Content | Building use categories |
| Best used for | Planning context, site appraisal and land-use analysis |
Building Use Data classifies buildings by likely use, helping users understand local context and land-use patterns.
It contains 28 CAD layers that show the most recent and comprehensive building usage and access data collected by the Ordnance Survey. These are: Agriculture Or Aquaculture, Attraction Or Activity, Animal Services, Distribution Or Storage, Industrial Or Manufacturing, Commercial Activity: Other, Retail, Emergency Services, Funerary, Community Services, Religious Worship, Construction, Defence, Education, Government Services, Historic, Medical Or Health Care, Mixed Use, Residential Accommodation, Sports Attraction Or Facility, Temporary Or Holiday Accommodation, Transport: Air, Transport: Rail, Transport: Road, Track Or Path, Transport: Water, Unknown, Unknown Use and Utility Or Environmental Protection.
The layer is constantly updated with up to daily updates from the OS.
Building Use data has many applications. It can be used to quickly understand building usage at specific locations (e.g. ‘private residential’ or ‘primary school’), to compare and contrast the density and distribution of site uses across regions (e.g. all schools in a county), and to understand how accessible major sites are (e.g. where schools, train stations, and public parks are) and how they connect to the road network (e.g. for better transportation planning and efficient navigation). It’s useful for planning applications, site analysis, design and access statements and much more.
It is a geographic depiction of a building that is designated as being utilised for a specific purpose, such as a school, shopping mall, or private dwelling. It aims to identify the scope of the activity, and while this may be comparable to or identical to the ownership information provided by HM Land Registry (HMLR) or Registers of Scotland (RoS), it should not be interpreted as indicating legal scope or ownership.
Building Use Data is available from MapServe from £13.72.
Building usage serves various purposes such as justifying proposed use on new sites, aiding in planning and architectural decisions by understanding site safety and services impact, and informing planning statements. It also assists in change of use situations, streamlines planning applications, supports design and access statements, aids in architectural and lease plans, and helps in pre-application inquiries.
Yes. It is useful for early planning context and feasibility, but it should not replace formal planning records.
Building Use Data is available in DWG and DXF formats.


