Instant Download
Colour And Black & White Options
Save up to 40% vs. Other Suppliers


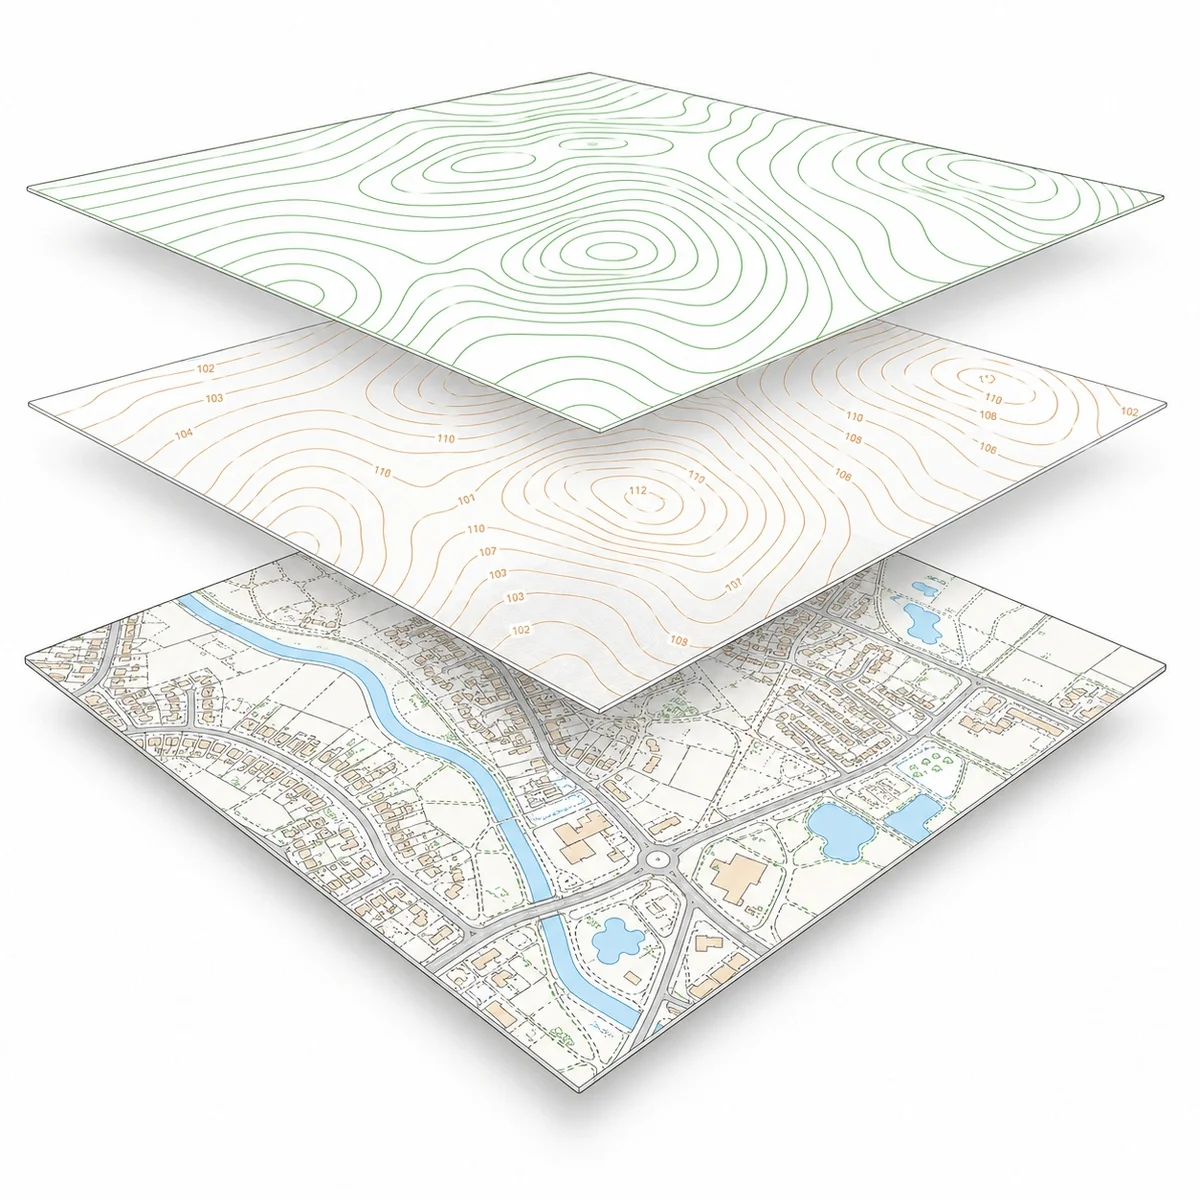
1m Contours show changes in ground height using contour lines at 1-metre elevation intervals. Each contour line connects points of equal height, helping architects, surveyors, planners and engineers understand the shape, slope and fall of a site.
MapServe supplies 1m Contours as an additional CAD layer with OS MasterMap®, available in DWG and DXF formats. The layer is useful for site analysis, planning work, drainage review, access design, feasibility checks and early-stage design. The current MapServe page confirms that 1m contours are supplied as an additional OS MasterMap® CAD layer in DWG and DXF, with yearly updates and delivery within seconds.
The dataset is derived from LiDAR height data. MapServe’s launch article states that the 1m contours are referenced to Ordnance Survey Newlyn using OSTN15, with a vertical accuracy of ±15cm RMSE.

| Sector | Need | Why it's used | Typical format |
|---|---|---|---|
| Architecture | Understand slope before design | Helps assess level changes, access, ramps, retaining walls and site layout constraints | DWG, DXF |
| Planning | Support site appraisal and constraints checks | Shows how landform may affect drainage, access, overlooking and development impact | DWG, DXF |
| Surveying | Add terrain context to CAD base mapping | Provides a useful elevation layer before or alongside measured survey work | DWG, DXF |
| Engineering | Review gradients, drainage and earthworks | Helps identify fall, low points, cut-and-fill risk and route feasibility | DWG, DXF |
| Development | Assess site viability earlier | Helps identify sloping sites, abnormal costs and layout constraints before detailed design | DWG, DXF |
| Landscape design | Work with existing landform | Supports level design, planting, paths, terraces and landscape strategy | DWG, DXF |
| Map product | Best used for | Key limitations |
|---|---|---|
| 1m Contours | Detailed slope, fall and landform context in CAD | Does not replace a measured topographic survey |
| OS Terrain 5 | Wider-area terrain modelling and 5m contour context | Less detailed than 1m contours for site-level analysis |
| Topographic survey | Accurate site-specific levels and physical features | Requires survey work and is usually more expensive |
| Aerial photography | Visual site context | Does not provide structured elevation or contour information |
| Site visit | Visual inspection and practical judgement | Does not provide CAD-ready contour data |
1m Contours are useful for early terrain understanding, but they are not suitable for every level-related task.
| Attribute | Description |
|---|---|
| Coverage | Great Britain, subject to available contour coverage |
| Formats | CAD (DWG & DXF) |
| Options | Colour, black & white |
| Printable scales | 1:100 – 1:10,000 |
| Stated accuracy | Urban +/- 1m, rural +/- 2.5m, moorland / mountain +/- 8m |
| Updates | Yearly |
| Delivery | Within seconds of ordering |
| Licence options | 12 months (other options available on request) |
| Projection | OSGB36 geodetic datum using Transverse Mercator projection |
| Grid | British National Grid |
| Supplied with | OS MasterMap® |
| Price | From £13.72 |
| Best used for | CAD, site analysis, slope checks, drainage review, feasibility and planning context |
| Contour interval | 1 metre |
| Content | Contour lines and contour height text |
1m Contours are contour lines shown at 1-metre elevation intervals. They help show the shape, height and slope of the land.
1m Contours are available from MapServe from £13.72, when added to a map order.
A contour line connects points of equal elevation. Where contour lines are close together, the land is steeper. Where they are spaced further apart, the land is flatter.
MapServe supplies 1m Contours as an additional CAD layer in DWG and DXF files.
They are useful for planning context, site analysis, access checks and drainage review, but they do not replace a measured topographic survey where one is required.
1m Contours are not currently available as a live preview layer. Sample files are available so you can see how the layer appears in CAD.
MapServe’s current 1m Contours page states that they are updated yearly.
DWG and DXF files require CAD software, such as AutoCAD or a compatible CAD viewer.
No. They are useful for desktop assessment and early design context, but a measured topographic survey should be used where exact site levels and physical features are required.
They are used for site analysis, architectural design, planning appraisal, drainage review, access checks, slope assessment and early earthworks planning.
No. They show landform and gradient. They can help infer likely surface water flow paths, but they do not show underground drainage infrastructure.


