What are contours?
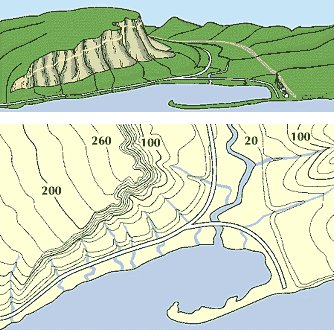
Contour lines are the faint red-brown lines drawn on a map connecting points of equal elevation above sea level, meaning if you physically followed a contour line, the elevation (height of the land) would remain the same. Contour lines show elevation and the shape of the terrain. They're useful because they illustrate the shape of the land surface on the map. In other words, contour lines show the topography of the land. Understanding contours is a skill that will allow you to look at a map and picture the hill, with depressions for streams, hills and thin mountain ridges, etc. Contour lines are pictorial, meaning they do not exist on the ground.
Download 1m Contours of the UK for CAD software here
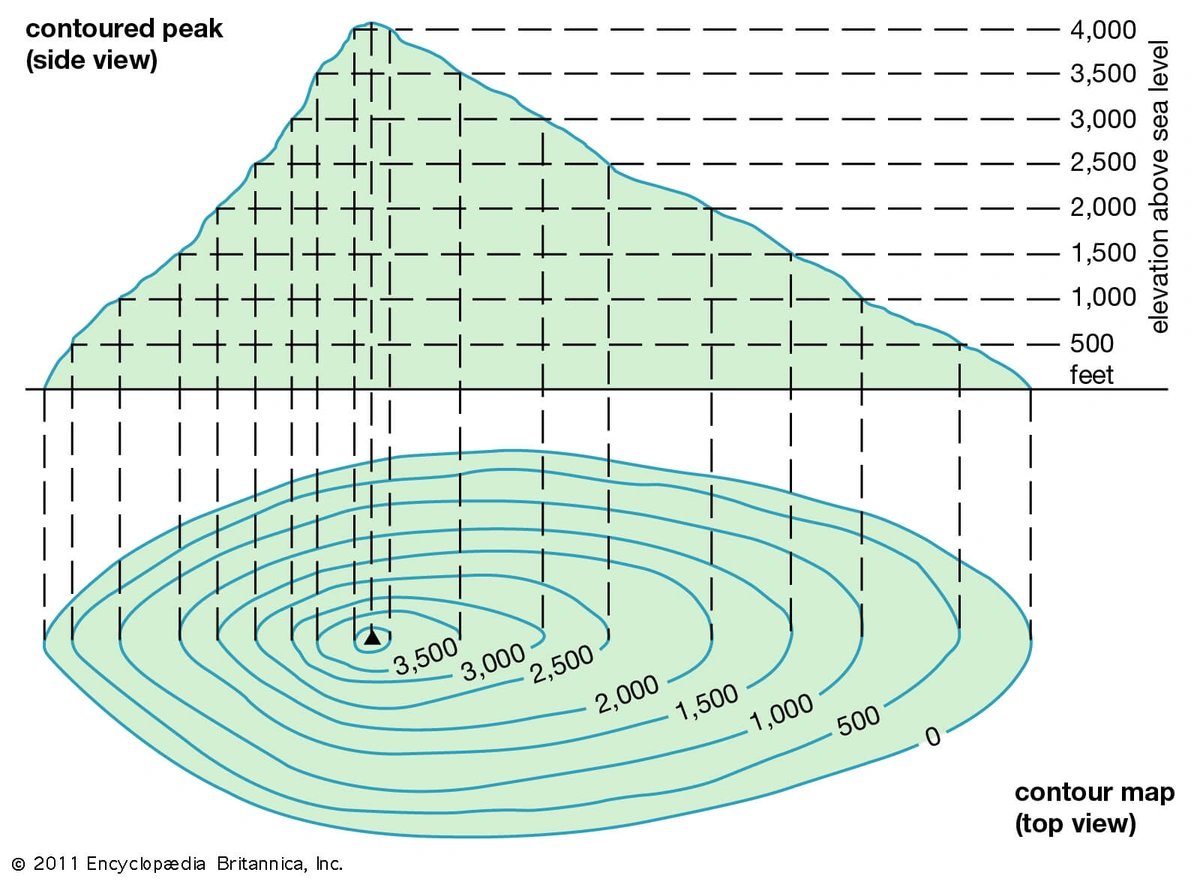
Diagrams provided by Encyclopaedia Britannica
Contour lines are critical to understanding the elevation profile of your terrain or a particular land formation. This information can be helpful when selecting a hiking route. In addition to backpacking and hiking, countless other professions use them - land surveyors, architects foresters, engineers, miners, geologists, hunters and more.
Topography is the study of the geographical features of a landscape. A map with contour lines on it is called a topographic map. Topographic maps use a combination of colors, shading and contour lines to represent changes in elevation and terrain shape. Specifically, a topographic map represents the three-dimensional landscape of the Earth within the two-dimensional space of a map.
The first known maps to include geographical features were found in Ancient Rome. It would be thousands of years before cartographers could chart large areas of terrain with any real accuracy. The contour lines we are using today came into popular use in the mid-1800s along with the rise of resource extraction industries like mining and logging.
When checking quickly a topographic map you can immediately know if a landscape is mountainous or flat.
If each line represents an equal point of elevation, then any change in elevation would lead to inconsistent line spacing. For example, several contour lines spaced close together would indicate steep terrain, while lines spaced far apart would indicate a gentler slope.
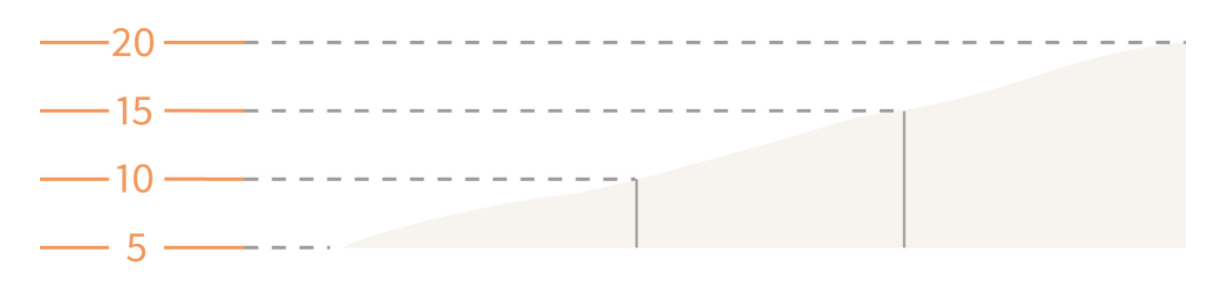
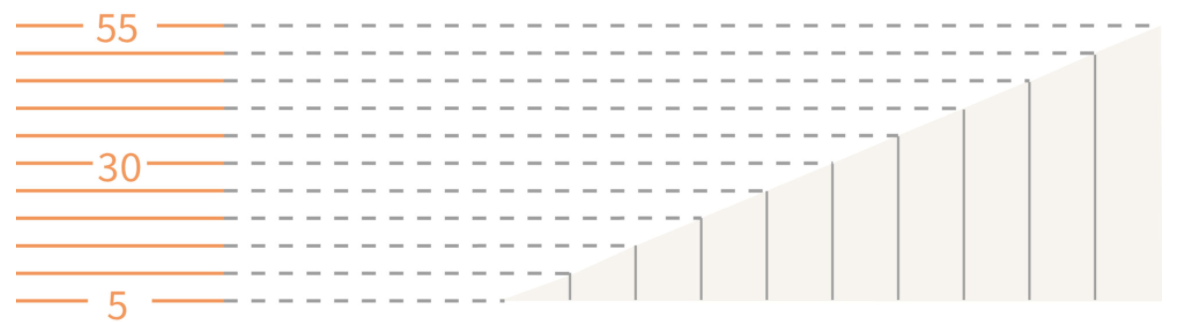
Shallow slope (the contours are spaced apart) Steep slope (the contours are close together)
Diagrams provided by https://getoutside.ordnancesurvey.co.uk
There are 3 kinds of contour lines you’ll see on a map: intermediate, index, and supplementary.
- Index lines are the thickest contour lines and are usually labeled with a number at one point along the line. This tells you the elevation above sea level.
- Intermediate lines are the thinner, more common, lines between the index lines. They usually don't have a number label. Typically one index line occurs for every five intermediate lines.
- Supplementary lines appear as dotted lines, indicating flatter terrain.
Contour file formats
The contours are offered as an additional layer on DWG and DXF files.
In order to view these formats, you would need the appropriate software. Both of these formats require CAD software (free viewer here Autodesk Viewer).
Applications that require contours
They are used for several types of activities such as emergency preparedness, urban planning, architectural design, resource development and surveying to camping, canoeing, adventure racing, hunting and fishing.
Topographic maps have multiple uses in the present day: any type of geographic planning or large-scale architecture; urban designing, surveying, resource development as well as in earth sciences and many other geographic disciplines; mining and other earth-based professions (such as planning and constructing ponds); and recreational uses such as hiking, camping, canoeing, adventure racing, hunting, fishing and in particular, orienteering, which uses highly detailed maps in its standard requirements. Topographic maps can be used to determine the percentage of a slope, a potential pond, or a development site by a developer. These maps allow you to layout a road with an acceptable slope. MapServe®, offers topographic maps with contours of 1m.
Why you should buy contours from MapServe®
On MapServe® we offer 1m contours as an optional CAD layer to MasterMap®. They are available in DWG and DXF formats. Our contours are an accurate representation of the topography of the land and cover over 60% of England, Wales and a section of Scotland.
The dataset is derived from a Light Detection and Ranging (LIDAR) survey undertaken by the Environment Agency. This is an airborne mapping technique, which uses a laser to measure the distance between the aircraft and the ground. Up to 500,000 measurements per second are made of the ground, allowing highly detailed terrain models to be generated at spatial resolutions of between 25cm and 2 metres.
The 1m contours are referenced to Ordnance Survey Newlyn, using the OSTN’15 transformation. The LIDAR data has a vertical accuracy of +/-15cm RMSE.
Download 1m Contours of the UK for CAD software here
Contour Examples
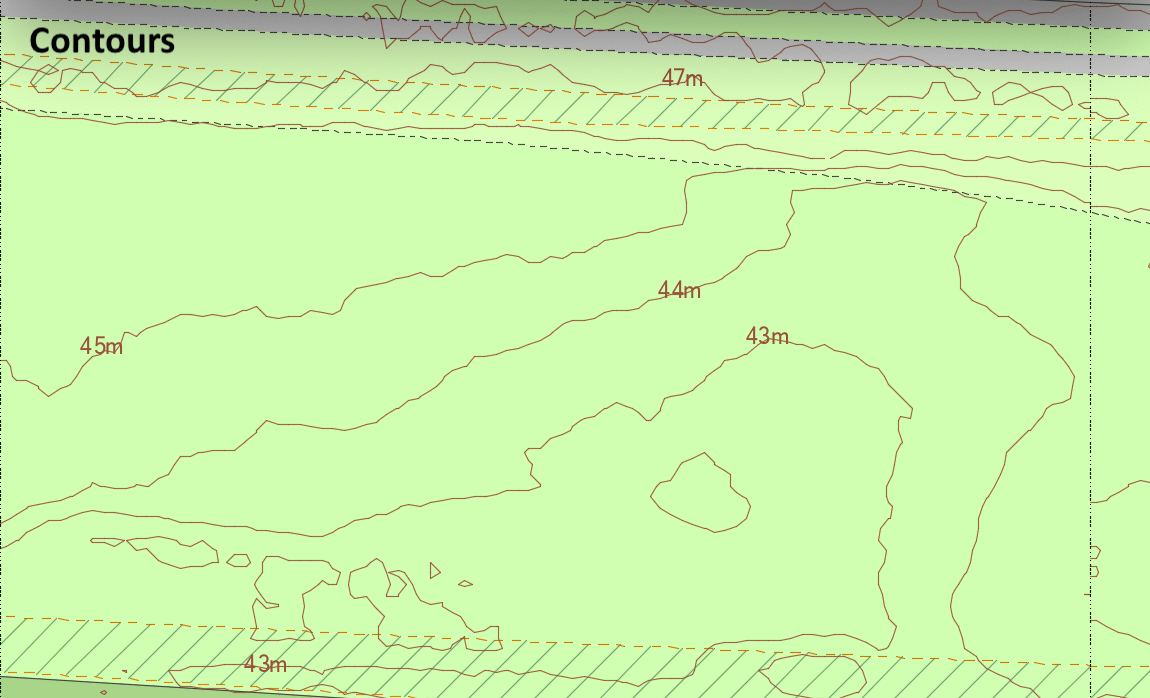
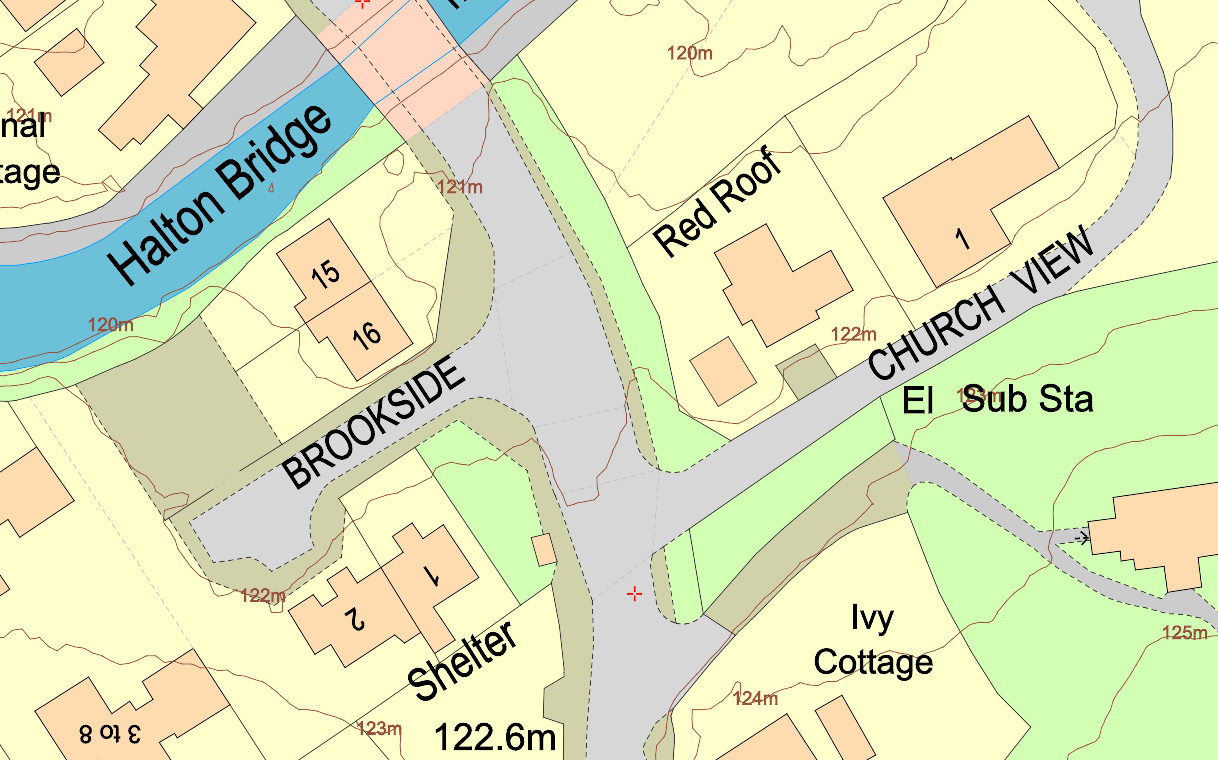
Contours on OS MasterMap®