This article will explain how maps can be an extremely useful tool during every project stage of the RIBA Plan of Works from helping to formulate a design to submitting to the local authorities and prepare reports for site safety, sustainability, and maintenance.
Architects use maps to gather important data gathered during surveys, research and analysis. A map is a focal point for tracking information collected on environmental, functional and social aspects of a design project as it progresses. Data visualisation allows architects to research and present site possibilities and characteristics that offer insight into the project helping the development of design solutions. When the information is exhibited visually it is much simpler to extract significant patterns and knowledge that might rather be indistinguishable in numbers, and this essentially permits to develop conclusions and make informed design decisions. Not only does this display of information aid the designers with their projects, but it can also demonstrate data to a client more understandably, helping them to acknowledge the origin of the design decisions and allowing them to engage with the design process from a preliminary stage.
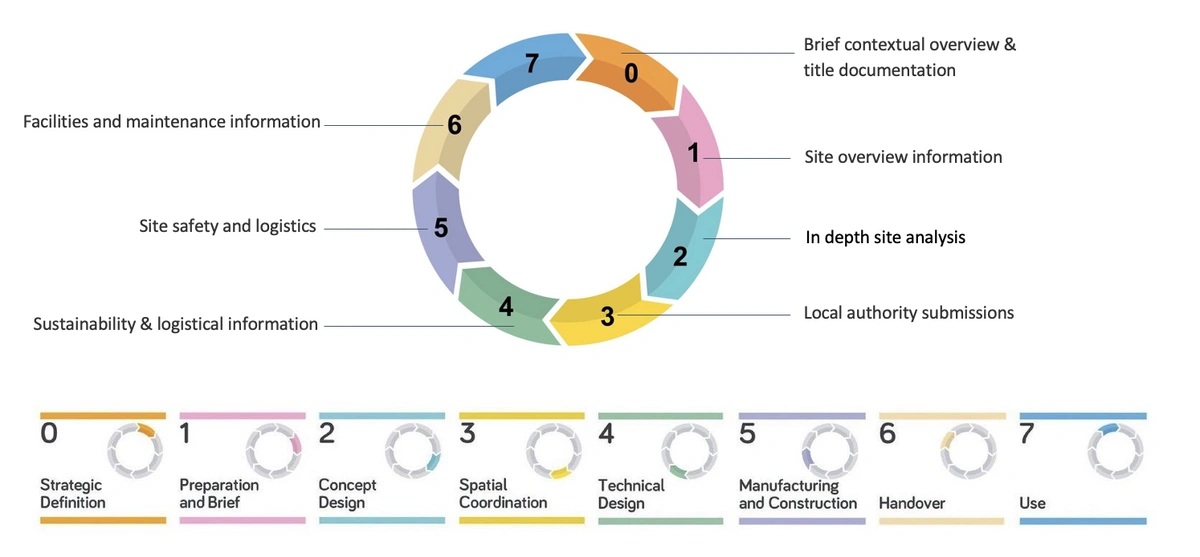
Stage 0
At stage 0, a strategic appraisal is needed using a topographical map to look at the client’s aims and how they relate to the site. Analysis of the local area and its context is used to check project risks relating to the environment, foliage, building type, density, height, land use, and any surrounding listed buildings or conservation areas. Considerations of local authority strategies can also be needed. Mapping including building heights, can provide an initial understanding of the building massing surrounding the project area. The data is available in PNG and CAD formats. Obtaining tree mapping like the ‘National Tree Map™’ aids in understanding the location and size of local trees and helps with planning and costs.
Flood mapping can classify sites into different levels of risk and identify whether a site is suitable for construction. It is normally available for free from bodies like the Environment Agency. Other geospatial information to consider include surrounding building uses, listed buildings and conservation areas, the latter two available from the local authority website.
Stage 1
Once the limitations to the client’s scheme have been established, more information will be required to generate a building form. This is where a variety of mapping data are most useful. Site specific information such as boundary lines help to identify any discrepancies between the site and title plan, the location of the entrances and existing services, any easements or access issues and how orientation impacts the site. Pre-application research is also undertaken including rights of light and proximity to neighbouring buildings to inform the early design decisions and help form feasibility studies and massing ideas.
3D building models are available for analysis of viewing corridors, viewshed and massing studies. These are usually available ‘off the shelf’ in major cities like London and created bespoke to order for other areas in CAD and other 3D file formats.
Combining large scale topographic mapping like the OS MasterMap® and freehold boundaries, can identify property owners and easily resolve common discrepancies. Aerial photography can be used to understand the site in question and roof materials, tree coverage and building types, in advance of an on-site survey. It is now widely available online covering the whole country with differing ages of photography and detail. Typical resolutions are 12.5cm - 25cm (each pixel covers that area on the ground) for UK wide ‘off the shelf’ pre-flown photography. Orthorectification ensures it is ‘map accurate’.
OS MasterMap® & Building Heights 3D Model
Stage 2
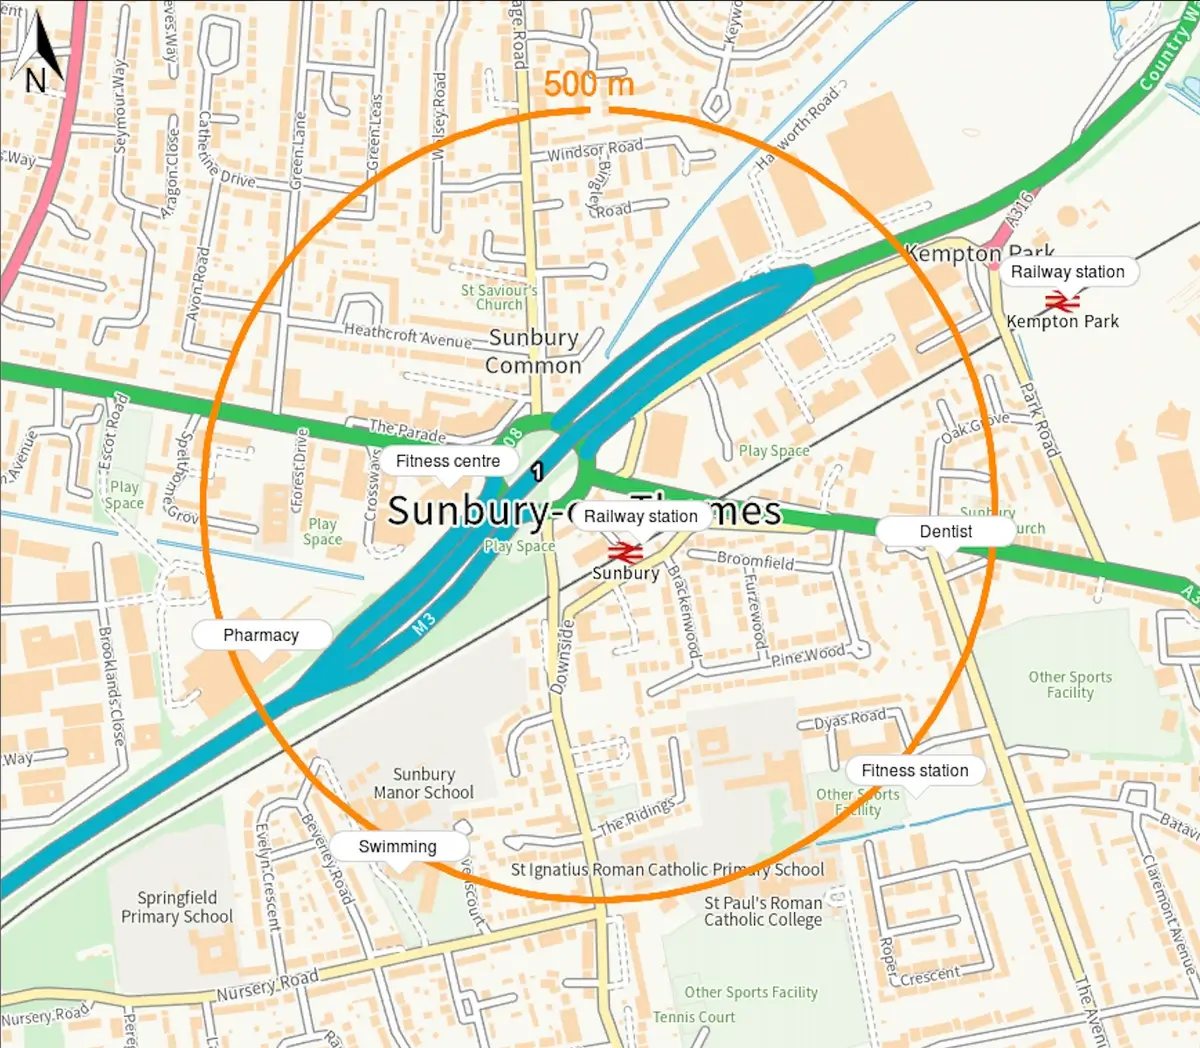
During stages 2 and 3 information for planning applications and other legislation is required. Maps will be needed when planning for multiple documents such as the mandatory Site and Location plans, where a scale bar and North arrow are a compulsory requirement. Additionally, during the 2nd stage, the Design and Access Statement (DAS) is being prepared. This includes research on the on-site history, local transport, sustainability, and site-specific information on climate. Large scale topographic mapping is always included in a Statement, usually showing the site analysis, the location of the project and its relationship to the surrounding buildings and area. Aerial photography, roof height data and 3D mapping are also needed depending on the project and the scale of the development. Further information can also be included such as how the design deals with refuse collection, cycle storage, parking, and demolition and phasing will also need to be explained within the planning application. SUDS (sustainable urban drainage strategy) and CIL (community infrastructure levy) calculations will need to be undertaken too. Other legislation such as CDM documentation should be produced towards the end of stage 3, which must include site layouts and logistical planning, for example, hoarding layouts, site
accommodation, evacuation routes, vehicle approaches, turning and waiting areas and plans for bulk deliveries and lay down areas. Level access routes into and out of the site will also need to be analysed for inclusive environments and building regulation approval.
During the 2nd stage, the Design and Access Statement (DAS) is prepared in order to explain the design thinking behind a planning application. This includes research on site history, local transport, sustainability, and site-specific information on climate for example wind, noise, and sun path. Large scale topographic mapping is also included, usually showing the site analysis, the location of the project and its relationship to the surrounding buildings and area. Historical and 3d mapping, aerial photography, roof heights are also needed depending on the project and its scale. A site analysis should be included in the Statement which can be created using MapServe®’s Site Analysis or created manually.
Stage 3
A DAS is finalised and submitted as part of the Planning Application at the end of Stage 3.
Accurate, up to date highway mapping featuring dimensions and accessibility of roads, can assist crane operations, evacuation routes and vehicle approach, access, turning and waiting areas. These are useful in completing the DAS and CDM documentation and aid in sustainability planning and disabled access into and out of the site.
Stage 4
During stages 4 and 5, the scheme will undergo technical design and construction. By this stage the use for maps and other data has largely been gathered, however, information will still need to be prepared using maps, including preparing BREEAM reports, which include analysis of the surrounding area such as local public transport. CDM documentation will need to continue to be gathered, for example, for finalising logistics and integrating any changes to previous information.
Some unexpected changes on site require mapping products such as unplanned road closures, which would require an annotated map to be submitted to the local authorities highways department.
Stage 5
Information will also need to be prepared for fire strategies, hydrant locations and assembly points for both the site during construction, and end users. Mapping of utility services for a given area is normally a bespoke service provided by specialist providers. A survey of any underground services is often required to ensure the safety of workers and the public during excavation and construction work. Furthermore, drainage maps with any updates can be useful for maintenance and facilities management.
An extensive topographic map is typically used to prepare these reports. The MasterMap® from the Ordnance Survey is the most common large scale, professional topographic map type used by architects, but others exist covering cities only. It is a vast database that records every fixed element in Great Britain such as buildings, roads, pathways, railways, rivers, lakes, ponds and other structures. Such mapping is surveyed on an ongoing basis, in the case of MasterMap® but as with all mapping, it can never be as accurate as a detailed on-site survey. It is typically available in CAD format and other formats like PNG and PDF. CAD versions offer multiple layers to allow control over formatting. It is typically used in planning submissions and site plans.

OS MasterMap® - Topographic Large Scale Map
Stage 6
Maps are less useful to architects during the last stages, however, maps and other data will be used to hand over information to the end user or the facilities and maintenance department. This information includes facilities and management information, final information for CDM documentation, and fire safety data.
One example of recent mapping progress is indoor mapping which is a revolutionary concept that transcribes an indoor space and spatial data on a digital 2D or 3D map. Showing places, people and assets on a digital map enables solutions such as indoor positioning and navigation within a space. Indoor mapping can partly be generated from the original CAD format architectural plans. When combined with additional meta data and spatial information, they can then be used for facilities management. For example, indoor mapping combined with data from room sensors, can reveal how people are interacting with the space to highlight where underutilised spaces are. It can also assist with security and indoor route finding for large spaces once the building is in use.
Stage 7
Fire escape plans will be necessary for health and safety information and facilities management. As part of a building’s comprehensive fire prevention and safety measures, an evacuation plan is prioritised and all users of the building must be aware of its contents and its location. This is usually based on a detailed site plan as building users will also need to be aware of assembly points outside of the building.
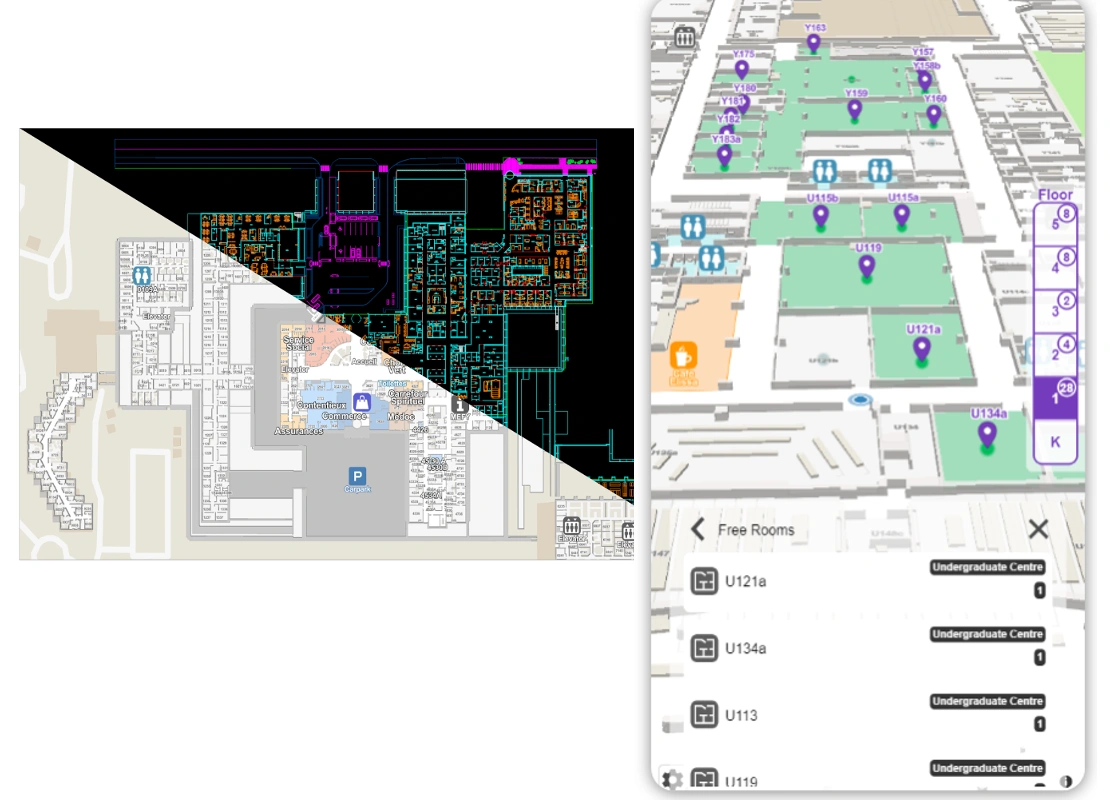
Indoor mapping example